In our last blog post, we delved into the importance of wire data for measuring performance in financial markets and talked about extracting wire data via packet captures. We also discussed why it was useful to go beyond traditional packet capture by decoding the data and providing in-depth analyses.
Today’s post will take a look ‘under the hood’ to see how Beeks Analytics achieves precision data capture for replay and analytics.
Rich history of innovation
Beeks Analytics has a rich heritage.

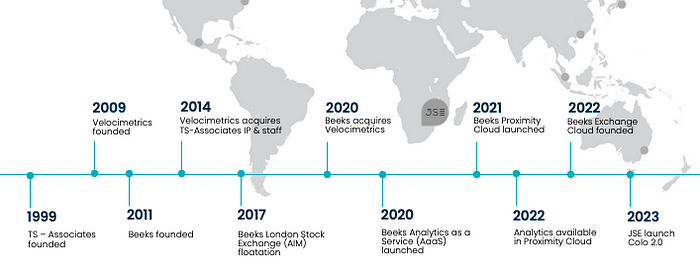
In 2020 Beeks acquired Velocimetrics, an innovative fintech founded in 2009. Velocimetrics incorporated technologies and expertise from another innovator, TS-Associates, established in 1999. Where Velocimetrics’ main focus was summarising complex network and application events in easy-to-understand business terms, TS-Associates focused on high performance engineered solutions. The combination with Beeks then brought global scale and the ability to host services on behalf of our clients.
The result? A Beeks Analytics architecture that delivers unparalleled performance monitoring and analysis for financial markets.
We’ll take a look at the components in Beeks Analytics architecture in the next post in this series. Today, let’s talk about the value it will add to your organisation.
Achieving superior observability
Beeks is the only cloud provider that’s finely tuned to the core requirements of capital markets. Beeks Analytics extracts high-quality wire information, measured precisely at the boundaries of your operational areas, to deliver insights that support a trusted, favoured, high-speed trading environment.
We have the following architectural goals in mind as we develop the Beeks Analytics architecture:
- Enable highly performant dropless distributed packet capture.
- Decode any public financial market protocol, and provide tools that make it easy to decode proprietary protocols.
- Make the architecture as open as possible, because wire data shouldn’t live in a silo — it should be easy to integrate with other data.
- Make the architecture as modular as possible.
- Prioritise scalability. You shouldn’t need a small mountain of Beeks Analytics hardware to perform your analytics needs. We commit to always stay ahead of the growing volume of data in financial markets, and offer consolidation opportunities to reduce the monitoring hardware footprint in datacentres.
Let’s cover each of these in a bit more depth.
The ultimate in distributed packet capture
Beeks Analytics delivers high-volume and granular capture of wire data. We can capture 100Gbps to 400Gbps without dropping packets. This is important with the growth in financial market volumes.
We provide this high-performance capture whilst at the same time providing nanosecond-precision timestamping. Or we can read the timestamps provided by switch vendors, which allows us to provide maximum possible microburst measurement. Microbursts are a particular feature of financial markets, where one unexpected price movement or piece of news can trigger multiple overlapping bursts of data. If you don’t size your network to accomodate these, you’ll experience delays or, even worse, data loss.
The high precision packet capture also includes analysis of network quality metrics such as TCP loss, TCP round-trip or TCP zero window size.
Advanced data decoding
To enable ingestion of any type of data, Beeks Analytics has a vast range of off-the-shelf decoders for the majority of the world’s financial markets and common underlying protocols. If you need a custom decoder, you can create your own using our Advanced Configurable Decoder (ACD)™ or SDK.
Decoding data unlocks value added metrics, such as:
- Gap detection
- App to Wire latency for every message
- Statistics breakdown per message property e.g. Fill Ratio, Latency per counterparty, latency per symbol
- Round-trip measurements (e.g. Tick to Order, Order to Ack, Order to Fill) or order tracking, using timings as close to your customer (or counterparty) as possible — providing real-world performance measurement
Open architecture
At Beeks, we prioritise an open architecture. Beeks Analytics is available as an appliance, a cloud service, or via cross-connect, and if required, you can run the software on your own hardware. This highly-flexible approach frees you from the commercial and operational burden of having many unused appliances cluttering your data centers. We also allow flexible licencing, for example:
- Licencing a subset of cores on a machine, allowing for future growth without needing expensive and wasteful hardware replacement.
- Seamless transfer of software licences from an old machine to a new machine — we want to earn revenue for the quality of our service and our rapid innovation, rather than from charging our customers twice (or more!) for the same monitoring capability.
Scalability
Beeks Analytics’ architecture is scalable far beyond typical expectations. Our VMX-Capture stack scales per CPU and can be load balanced by an FPGA, leveraging Moore’s law to provide greater visibility at a lower price. This ensures that you can stay ahead of increasing market data and trade messaging volumes cost-effectively.
Clean and modular
Beeks Analytics is modular, meaning you can install only the software you need. From a basic packet capture solution to a full many-to-many correlation analysis supported by our extensive range of decoders, Beeks can meet your requirement.
Open Architecture in more detail
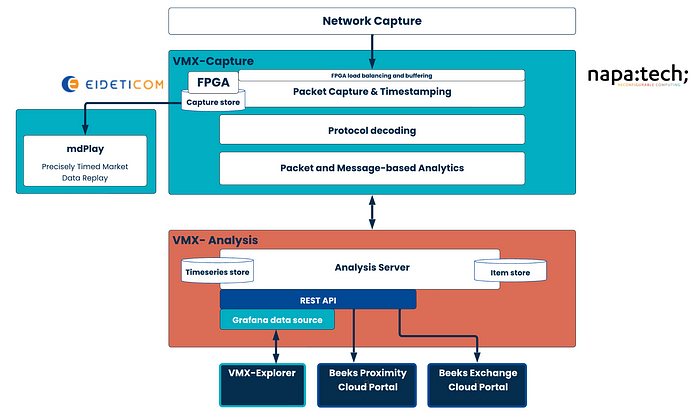
The diagram below is a high-level view of the main components and workflows in Beeks Analytics. If you want more information, the Beeks technical documentation site has more details.

VMX-Capture
- Responsible for data capture and decoding.
- Packet capture via a set of FPGA cards that deliver high-performance capture and compression, that include a Capture Card that provides buffering, timestamping, and traffic separation, and an optional Compression Card provides compression (when writing captures to disk)/decompression (when reading packet captures).
At its simplest, you can use VMX-Capture as a packet capture appliance: writing packets to disk and making them available for search and retrieval. However, VMX-Capture does so much more than this. It can also decode data, generate invaluable aggregated statistics, and egress data via our Core Data Feed.
VMX-Analysis
- Responsible for analysing data from VMX-Capture and passing aggregated data to VMX-Explorer for visualisation.
- Supports higher-level configuration of flows and business objects, summarising information about your network in business terms. This includes configuring complex message correlation logic with VEx, Beeks Analytics’ rich expression language.
The Analysis Server offers a flexible framework that enables you to code and plug in your own processing units (PUs) to add or change service behaviours.
mdPlay
- An optional standalone replay-only version of the main VMX-Capture component.
- Replays real data captured previously by Beeks Analytics to enable you to reproduce conditions that occurred during poor system performance or to optimise performance and test scaling.
- Replays from any packet capture, not just those recorded by Beeks Analytics.
For more on mdPlay, refer to our market data replay article.
VMX-Explorer
- A web-based user interface that uses Grafana to visualise analytics provided by Beeks Analytics.
- Beeks Analytics provides a dedicated data source for Grafana.
- VMX-Explorer includes off-the-shelf dashboards for common analysis needs, and you have complete freedom to create your own queries and visualisations.
Read more about VMX-Explorer.
Proximity Cloud and Exchange Cloud portals
Beeks Analytics metrics are also available in the Beeks portals for Proximity Cloud and Exchange Cloud services. Beeks portals enable you to manage your infrastructure and monitor it through the same interface.
What’s next?
In our next posts in this series, we’ll look at a challenging case study that really shows the power of Beeks Analytics, as well as exploring in depth the different types of latency detection, and the complex correlation between different messages in a flow.

